Change Language :
iglidur® C material data - no longer available
Material data table
General properties
Unit
iglidur® C
Testing method
Density
g/cm³
1.1
Colour
off white
Max. moisture absorption at +23°C/50% room humidity
% weight
1.0
DIN 53495
Max. moisture absorption
% weight
6.9
Coefficient of sliding friction, dynamic against steel
μ
0.17-0.25
pv value, max. (dry)
MPa x m/s
0.10
Mechanical properties
Flexural modulus
MPa
1,900
DIN 53457
Flexural strength (+20°C)
MPa
60
DIN 53452
Compressive strength
MPa
30
Maximum recommended surface pressure (20°C)
MPa
40
Shore D hardness
72
DIN 53505
Physical and thermal properties
Max. long-term application temperature
°C
+90
Max. short-term application temperature
°C
+130
Min. application temperature
°C
-40
Thermal conductivity
W/m x K
0.24
ASTM C 177
Coefficient of thermal expansion (at 23°C)
K-1 x 10⁻⁵
15
DIN 53752
Electrical properties
Specific transitional resistance
Ωcm
>1,010
DIN IEC 93
Surface resistance
Ω
>109
DIN 53482
Table 01: Material data
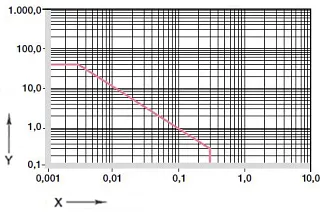
Diagram 01: Permissible pv values for iglidur® C plain bearings with a wall thickness of 1mm in dry operation against a steel shaft at +20°C, mounted in a steel housing
X = Surface speed [m/s]
Y = Load [MPa]
Plain bearings made from iglidur® C were developed especially for applications where the use of PTFE and silicon is not possible. Such applications can be found in electronics, tobacco and beverages industry and in many painting processes. Keywords like paint compatibility and silicon-free make the further employment of this material reasonable.
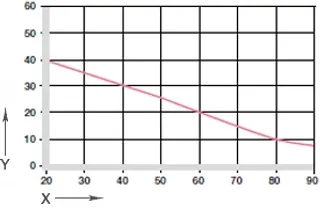
Diagram. 02: Maximum recommended surface pressure as a function of temperature (40MPa at +20°C)
X = Temperature [°C]
Y = Load [MPa]
Mechanical specifications
With increasing temperatures, the compressive strength of iglidur® C plain bearings decreases. Diagram 02 shows this relationship. The maximum recommended surface pressure represents a mechanical material parameter. No conclusions regarding the tribological properties can be drawn from this.
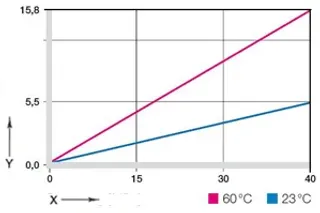
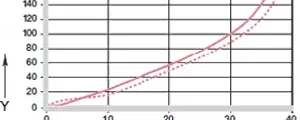
Diagram 03: Deformation under pressure and temperature
X = Load [MPa]
Y = Deformation [%]
Diagram 03 shows the elastic deformation of iglidur® C at radial loads. The high flexibility makes the bearing suitable for vibrations and edge loads.
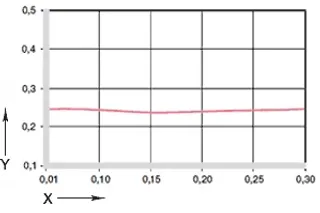
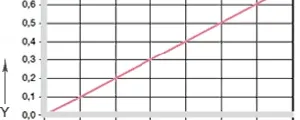
Diagram 04: Coefficient of friction as a function of the surface speed, p = 0.75MPa
X = Surface speed [m/s]
Y = Coefficient of friction μ
Friction and wear
The coefficient of friction of the iglidur® C plain bearings depends to a large degree on the shaft's surface finish. The wear of the bearings is very good in applications with rotating or pivoting movements with low loads.
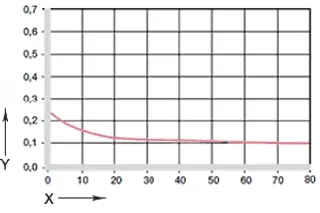
Diagram 05: Coefficient of friction as a function of the pressure, v = 0.01m/s
X = Load [MPa]
Y = Coefficient of friction µ
iglidur® C
dry
Greases
Oil
Water
Coefficient of friction µ
0.17-0.25
0.09
0.04
0.04
Table 04: Coefficient of friction of iglidur® C against steel
(Ra = 1µm, 50HRC)
Shaft materials
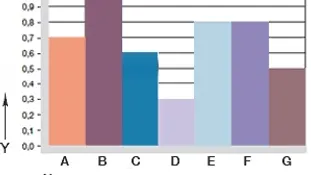
Diagram 06 clearly shows how important the most "suitable" shaft can be. Although all shown results of these rotation experiments can be understood as very good, the difference is sometimes significant. This difference increases still further with increasing loads.
Consulting
I look forward to answering your questions

Shipping and consultation
In person:
Monday to Friday from 7 am - 8 pm.
Saturdays from 8 am- 12 pm.
Online:
24h
WhatsApp-Service:
Montag – Freitag: 8 – 16 Uhr